
The fact that the Internet has (for better or worse) changed the world is an understatement. Numerous studies have been conducted on the correlation between high GDP growth and Internet penetration and speed, as well as their spillover effects into adjacent industries, both established and emerging.
The Internet has also changed how we perceive, interpret and consume media. Prior to the advent of the Internet, “media” was static. Now, media enjoys more mobility than ever – we literally carry it with us everywhere, on our laptops and mobile phones. This, in turn, has changed the way we choose where we travel and where we decide to settle. Cost is a big factor to consider – and as you’ll see in the following study, it varies from country to country.
This brings us to the purpose of this study.
Why We Did This Study
As stated previously, the popularization of the Internet has triggered a shift in how and where we consume media. While it’s difficult to determine which came first – the increasingly mobile nature of our media consumption habits, or the increasing accessibility both in cost and geographical spread of technology that makes this possible in the first place – one thing is for certain: streaming movies and consuming social media content is here to stay.
The main objective of this study is to provide travelers and digital nomads with an authoritative source of costs for consuming Internet content. We believe that this study is made all the more important by the fact that these factors can vary wildy from country to country (and even source to source).
Methodology And Sources
To conduct this research, we have collected the following data.
- Average price of 1GB of mobile data in each country (local currency) converted to USD.
- Cheapest 1 GB mobile Internet plan local (currency) converted to USD.
- Most expensive 1GB mobile plan (local currency) converted to USD.
- Average data requirements on YouTube, Facebook, TikTok, and Instagram.
Using the average price of 1GB of mobile data and the data requirements for each platform, we have calculated the average cost of one hour for:
- YouTube (1080p)
- Instagram.
- Facebook.
- TikTok Default mode.
- TikTok safe mode.
Another indicator that we looked at was the Internet speed requirements of various streaming and social media platforms. Upon further analysis, we found that the requirements are mostly uniform, with the differences being marginal at best.
Anecdotally, we have also looked at the below data points to further understand the digital landscape of the countries we have analyzed. It is worth noting that the following indicators did not have a quantifiable impact on the final standings:
- Cost of living
- Freedom of speech indicators.
- Freedom of press indicators.
- Monthly average cost for mobile monthly plans (10GB + data + calls)
- Fixed broadband speed (in mpb/s)
- Monthly average cost for broadband Internet.
Below, you will find the list of sources we accessed for each data point to conduct our study
- Cost of Internet/1GB
- YouTube (1080p) data requirements
- Instagram data requirements
- Facebook data requirements
- TikTok Default mode data requirements
- TikTok Safe Mode data requirements
- Average mobile speed (in mbp/s).
- Monthly average cost for mobile monthly plans (10GB+ data + calls).
Reasons For Internet Quality Costs Between Countries
- Geographic factors. For example, island nations can have worse Internet speeds due to geographic isolation and the difficulties to construct the necessary infrastructure.
- Geopolitical reasons that are beyond the scope of this study.
- Lack of regional ISP competition. The less competition, the higher the incentive for national companies to fix prices while providing a worse service.
- Size of country. Smaller countries tend to have less expensive Internet because there’s less physical ground to cover in terms of infrastructure.
- There is also the fact that developing countries that came into the Internet game later might have better (and less expensive) Internet than developed countries because they had the opportunity to access newer technologies from the get-go. In other words, it’s easier, logistically, to set up the latest infrastructure than to upgrade an old one. But as you’ll see, that’s not always the case.
Study Disclaimers
Before jumping into the study, it’s worth going over a few caveats:
- The costs/1GB of mobile data are averages derived from measuring varying numbers of plans in each country. Since data availability can vary from place to place, there are discrepancies in terms of number of plans measured between countries.
- To convert from local currencies to USD, we used the conversion rates listed on 7/09/2023.
- We have excluded the countries for which there is no reported data available.
- Some countries report better Internet speeds than they do in reality. On that same note, the numbers can vary from source to source, so it is always a good idea to do your due diligence and research different sources before making a decision.
- The monthly cost of Internet – speed ratio can be misleading. For example, in Armenia, where the average cost of a broadband Internet connection is $17, it might seem like Internet users get a good deal. However, when accounting for the reported average broadband speed of 48.53 mpbs (below average), you will discover that it amounts to 0.35 cents/mbps, a lot more expensive than other countries.
- Since some streaming services and most social media platforms don’t list their Internet speed requirements on their official websites, we have compiled an average from various sources.
Collected Insights
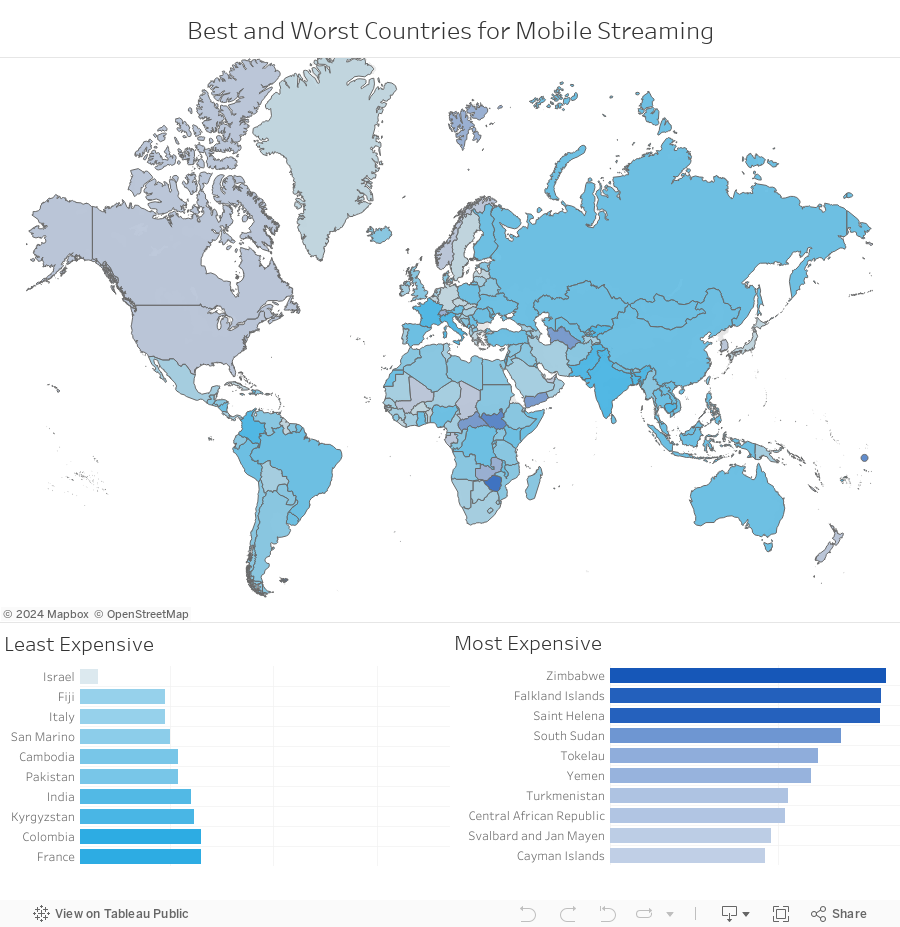
- On a worldwide scale, when accounting for cost/1GB, the country with the least expensive Internet is Israel ($0.02), while the country with the most expensive Internet is Zimbabwe ($43.75).
- In the Western hemisphere, The United States and Switzerland are the countries with the highest average price for 1GB of Internet data: $6 and $7.29, respectively.
- In the United States, 1 hour of TikTok content will cost you approximately $4.80 in Default mode, and $1.80 in safe mode.
- Israel has the lowest average price for 1GB of Internet data sitting at a baffling $0.02.
- In Western Europe, the lowest average price for 1GB of Internet data goes to Italy ($0.09) while the highest to Switzerland ($7.29).
- If we were to extend the radius to the entire European continent, the same countries (Italy and Switzerland) would maintain their rankings of countries with the cheapest and most expensive prices for 1GB of mobile data.
- Despite being in close proximity to each other, the Scandinavian countries (Norway, Sweden, Denmark) have wildly different average prices for 1GB of Internet. From lowest to highest: Denmark ($0.21), Sweden ($0.70), and Norway ($1.22). In other words, by traveling the shortest distance between Sweden and Denmark (4km, from Sweden’s Helsingborg Central lstation to Denmark’s Helsingør via ferry), you could technically access cheaper Internet in Denmark.
- The award for the South American country with the lowest average price for 1GB of Internet goes to Chile – $0.64.
- The South American country with the highest average price for 1GB of mobile Internet data is Bolivia – $1.87.
- In the Falkland Islands, one hour of YouTube at 1080p costs a whopping $121.74.
- In the Isle of Man, watching 1080p YouTube videos is approximately 4 dollars and 17 cents more expensive than watching TikTok in default mode – $4.32 vs. $1.15.
Below, you’ll find the countries with the least and most expensive Internet in ascending order.
Countries With The Least Expensive Internet – cost/1GB
| Country | TikTok | TikTok (data saver) | YT @ 1080P | YT @ 720P | Average price of 1GB (USD) | ||
| France | $0.10 | $0.12 | $0.16 | $0.06 | $0.59 | $0.30 | $0.20 |
| Colombia | $0.10 | $0.12 | $0.16 | $0.06 | $0.59 | $0.30 | $0.20 |
| Kyrgyzstan | $0.09 | $0.10 | $0.14 | $0.05 | $0.52 | $0.26 | $0.17 |
| India | $0.08 | $0.10 | $0.13 | $0.05 | $0.48 | $0.24 | $0.16 |
| Pakistan | $0.06 | $0.07 | $0.10 | $0.04 | $0.37 | $0.19 | $0.12 |
| Cambodia | $0.06 | $0.07 | $0.10 | $0.04 | $0.36 | $0.18 | $0.12 |
| San Marino | $0.05 | $0.06 | $0.08 | $0.03 | $0.29 | $0.14 | $0.10 |
| Italy | $0.04 | $0.05 | $0.07 | $0.03 | $0.26 | $0.13 | $0.09 |
| Fiji | $0.04 | $0.05 | $0.07 | $0.03 | $0.26 | $0.13 | $0.09 |
| Israel | $0.01 | $0.01 | $0.02 | $0.01 | $0.07 | $0.03 | $0.02 |
Countries With The Most Expensive Internet – cost/1GB
And these are the countries with the most expensive internet, in ascending order:
| Country | TikTok | TikTok (data saver) | YT @ 1080p | Yt @ 720p | Average price | ||
| Cayman Islands | $4.20 | $5.03 | $6.71 | $2.52 | $25.17 | $12.59 | $8.39 |
| Svalbard and Jan Mayen | $4.50 | $5.40 | $7.20 | $2.70 | $27.01 | $13.51 | $9.00 |
| Central African Republic | $5.45 | $6.45 | $8.72 | $3.27 | $32.69 | $16.35 | $10.90 |
| Turkmenistan | $5.71 | $6.85 | $9.13 | $3.43 | $34.25 | $17.13 | $11.42 |
| Yemen | $7.84 | $9.31 | $12.54 | $4.70 | $4.70 | $47.03 | $23.52 |
| Tokelau | $8.62 | $10.34 | $13.79 | $5.17 | $51.72 | $25.86 | $17.24 |
| South Sudan | $11.85 | $14.22 | $18.96 | $7.11 | $71.10 | $35.55 | $23.70 |
| Falkland Islands | $20.29 | $24.35 | $32.46 | $12.17 | $121.74 | $60.87 | $40.58 |
| Zimbabwe | $21.88 | $26.25 | $35.00 | $13.13 | $131.25 | $65.63 | $43.75 |
Bonus: Browsers that do more than just browse
While we’ve focused here on cost per GB and how data is consumed, it’s worth noting that some web-tools are designed to turn that usage into something more meaningful. For example, Wave Browser links everyday browsing to ocean-clean-up efforts.
Wave Browser is also AppEsteem-certified, meaning it meets industry standards for safety, transparency, and responsible software practices.
It’s a great example of how your choice of browser (and how you browse) can add value beyond access.